CPSC 110-08: Computing on Mobile Phones
|
Sorting algorithms are among the most important and the most studied algorithms in computing. Sorting refers to the process of arranging things into a certain order. Think about arranging a deck of cards in order by suit (clubs then diamonds then hearts then spades) and then rank (2, 3, up to Ace). Or, think about how Google presents search results, arranged in order from (what Google thinks is) most to least relevant to your query.
Sorting algorithms can differ significantly in their efficiency -- that is, in how long they take to sort a collection of data. In this homework you will be presented with two different algorithms and asked to identify which is the fast sort and which is the slow sort.
You are given an app that provides two different algorithms for sorting random lists of numbers. By varying the lengths of the lists and experimenting with the two sort algorithms, determine which is the fast algorithm and which is the slow algorithm.
In class, we will go over your results, look at the details of the algorithms themselves, and talk about how computer scientists analyze algorithms in terms of their efficiency.
Download the following app and install it on your phone or on the emulator.
 |
Source code: Efficiency.zip |
|---|
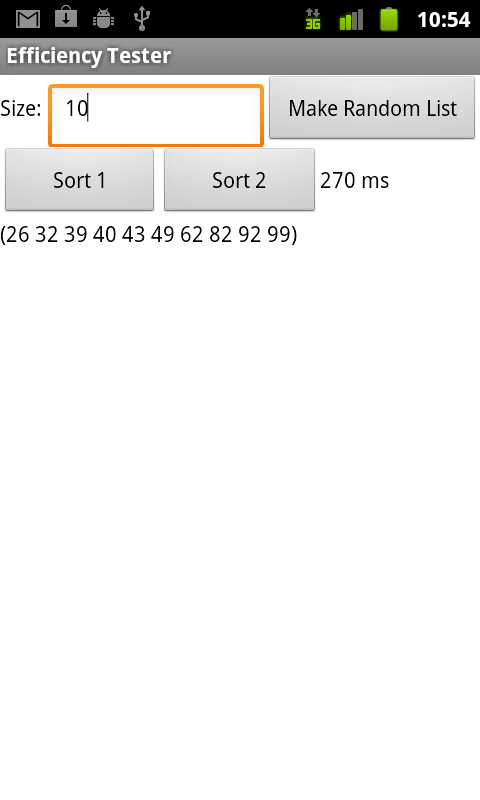
The app allows you to create random lists of up to 100 integers ranging in value from 1 to 100.
It then provides two buttons, Sort1 and Sort2. One button uses a fast sorting algorithm. The other uses a slow sorting algorithm. Each algorithm reports the amount of time in milliseconds that it takes to sort the list. Your job is to figure out which is which and to document your answer.
Run at least 3 trials for each Sort using lists of size 10, 20, 30, 40, and 50 numbers. Then compute the average number of milliseconds required for each sized list. Your results should be presented in tabular form:
List Size (N) Sort 1 Average Millisecs Sort 2 Average Millisecs 10 - - 20 - - 30 - - 40 - - 50 - -
Draw a graph to summarize your experimental results. The X-axis of your graph should represent the length of the lists. It should be labeled from 10, 20, 30, up to 100. The Y-axis should represent time in milliseconds and its labels should cover the range of average times you obtained in your experiments.
For each sorting algorithm, graph the data points you obtained in your experiments and connect the points with as smooth a line as you can.
Provide answers to the following questions on your portfolio.
Based on your table and your graph, which sorting algorithm is the fast sort and which is the slow sort? Justify your answer.
Can you predict approximately how long each sorting algorithm would take to sort a list of 100 random integers? A list of 500 numbers?
For either or both algorithms, do you think there is some list size, N, beyond which it would no longer be practical to sort the list with that algorithm on your phone or emulator?
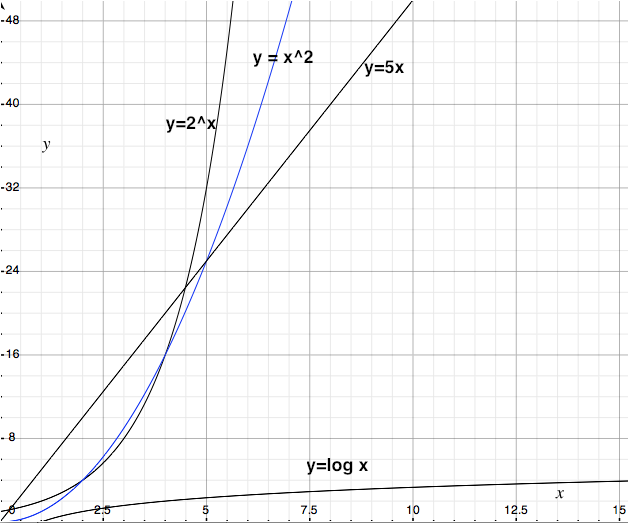
Consider the following diagram which shows the graphs of four different types of functions. (Click to enlarge.)
For Sort1, compare the graph of your results with the curves in this figure. Which curve does it most closely resemble, the logarithmic, linear, quadratic, or exponential?
Same question for Sort2. Which curve does it most closely resemble.